Financial

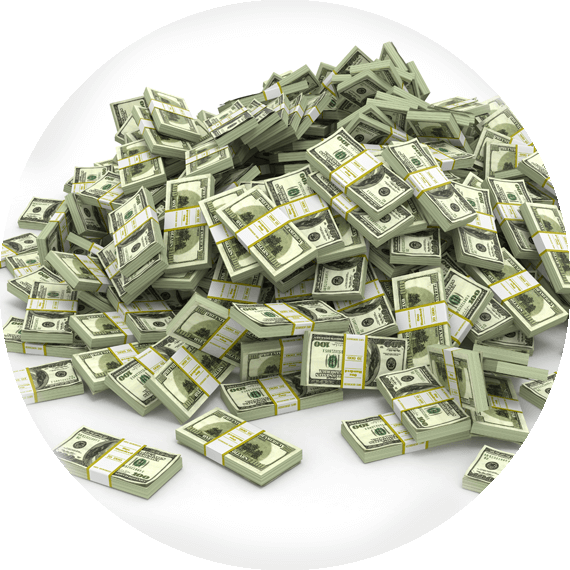
Free Cash Flow

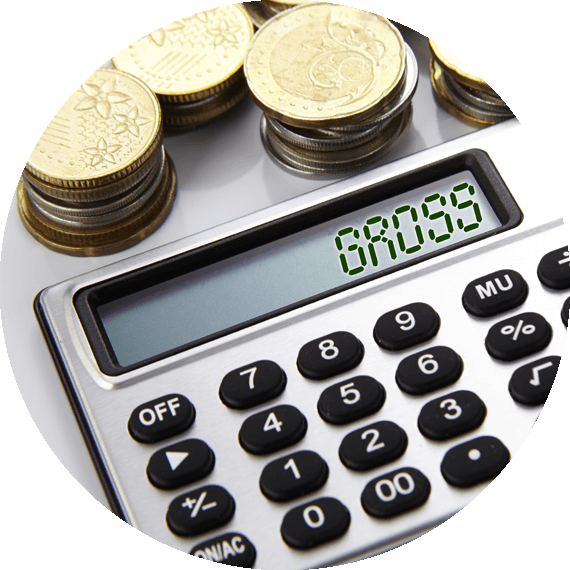
Cash from Operating Activities


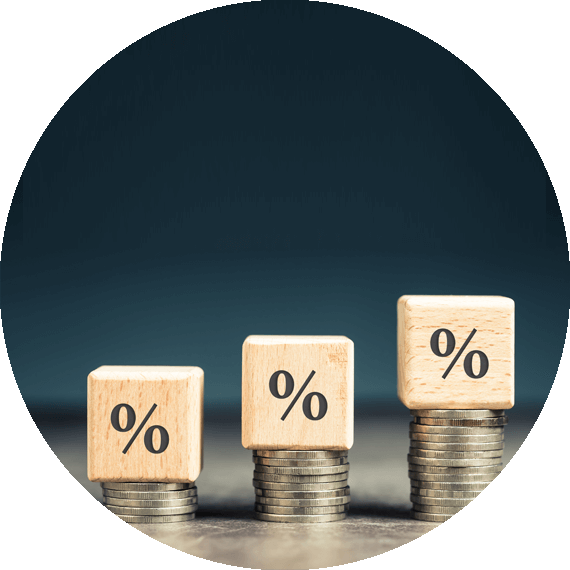
EBITDA Margin

Gross Profit Margins

Net Profit

Financial
Free Cash Flow
Cash generated each year which is free and clear from all internal and external obligations.
Airbus
Pepsico
Amazon
Cash from Operating Activities
Cash generated from ongoing , regular business activities.
Tesco
Bae
Walmart
EBITDA Margin
Earnings before Interest, taxes and depreciation as a percentage of its total revenue.
Sainbury
Emirates
Indian Oil
Gross Profit Margins
Gross profit as a percentage of net sales .
Carlsberg
Tesla
United Rental
Net Profit
Amount leftover for the company after all the expenses are met . (True bottom line)

Saudi Aramco
Berkshire Hathway